WaloViz
An open-source python package of an interactive audio player with a spectrogram built-in.
![]() WaloViz Website
WaloViz Website ![]() ,
, ![]() GitHub Repo
GitHub Repo ![]() ,
, ![]() Google Colab Demo
Google Colab Demo ![]()
TL;DR
Try clicking the spectrogram above, it will start playing :)
What is WaloViz?

WaloViz is an open-source python package for interactive Jupyter notebook based audio research, it creates an interactive audio player with a spectrogram built-in (What’s a Spectrogram?).
It works with wav files or any other audio format thanks to torchaudio and ffmpeg, and it is comfortably interactive thanks to the high customizability of the HoloViz ecosystem, hence the name - wav + HoloViz = WaloViz.
I created WaloViz with three main things in mind:
- It should be EASY - starting to use it requires 3 lines of code
- It should be POWERFUL - there are many advanced features, such as exporting to an HTML file and overlaying custom data
- It should be OPEN - open-source is the right place for WaloViz to exist, take a look at our GitHub Repo, and if you like it - consider giving us a

Why I started WaloViz

When I am doing audio research I constantly need to listen to audio files and see their spectrograms (What’s a Spectrogram?), there are many good dedicated tools that do just that, for example:
Just to name a few.
But they all suffer from the same problem - they are desktop tools that need the audio file locally - while my research is in a Jupyter notebook.
Some might say “that’s not that big of an issue, just create a file and download it”, but that becomes more and more annoying with more elaborate setups which have more audio files, very quickly it becomes a laboursome mess.
I found myself creating all sorts of ragtag visualizations to help me both play the audio and view its spectrogram in my Jupyter notebooks, I was shocked when I learned that many of my colleagues did the exact same thing in many different ways and circumstances.
Things like that drive me nuts!
So I did the only sensible thing anyone would do - I created yet another audio player to rule them all :)
What’s a Spectrogram?
Even if you know what Spectrograms are - the “Twinkle” spectrogram example will show you some advanced features you might like to know, if not - feel free to skip ahead :)

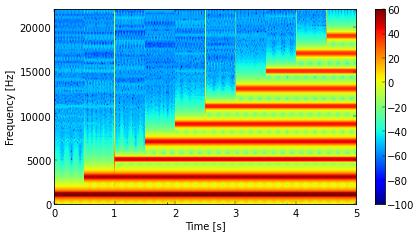
A Spectrogram is a big word, it literally means “A Picture of a Spectrum”, or in other words it’s a visualization of frequencies.
Let’s try to think of it in musical terms, each musical note has a base frequency associated with it, meaning that using frequencies is very similar to using musical notes, in that sense a Spectrogram is very similar to a musical sheet!

As you go from left to right you go forward in time, and as you go from bottom to top you go higher in pitch (frequency).
In a musical sheet the background is white, and a black spot means that note is played at that moment.
In a Spectrogram the background is black, and a bright yellow spot means that frequency is played at that moment.
One important difference is that in a Spectrogram the brighter the spot - the louder the sound, and it’s a smooth transition from very quiet (dark) to very loud (bright).
Another difference is that instead of different kinds of spots, to specify the length of the note the spot is stretched horizontally into a line. The length of the line is the length of the note!
Seeing the frequencies of an audio signal visually is very important, an audio expert can understand all sorts of things just by looking at a spectrogram, very similar to how a musician can understand a lot from reading a musical sheet.
Advanced Features
The first feature that researchers really like is overlaying curves over the spectrogram.
A very simple example of that would be to overlay the waveform itself or manipulations over it, it can be done in many ways, here is one of them:
In the above example there are 3 overlaid curves:
- The
waveform, it uses a callback to read the waveform and return it as a curve - The
envelope, it also uses a callback, but this time uses the waveform to calculate the envelope curve - A
randomcurve, it is just passed as a precalculated curve to be displayed over the spectrogram
From this simple example you can see how powerful this feature is for visualizing cases like SAD (Speech Activity Detection), Diarization, and many other audio related tasks.
WaloViz has many more features, go to the WaloViz documentation website to learn more :)